|
<< Click to Display Table of Contents >> The Eigenvalue Summary |
  
|
|
<< Click to Display Table of Contents >> The Eigenvalue Summary |
|
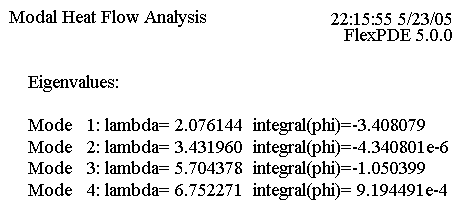
When running an Eigenvalue problem, FlexPDE automatically produces an additional plot displaying a summary of the computed eigenvalues.
If the user specifies a SUMMARY plot, then this plot will supplant the automatic summary, allowing the user to add reports to the eigenvalue listing.
For example, we can add to our previous descriptor the plot specification:
SUMMARY
REPORT(lambda)
REPORT(integral(phi))
This produces the following report on the summary page: