| Author | Message | ||
Achariya (jam_acha) New member Username: jam_acha Post Number: 2 Registered: 03-2009 |
1. How can I set Reynolds number for example Re = 0.1, Re = 100? 2. In viscous.pde, how program know that Re <0.1? 3. If I don't have channel blocked by a bar of square cross-section,How can I should rball=? | ||
Marek Nelson (mgnelson) Moderator Username: mgnelson Post Number: 115 Registered: 07-2007 |
1. You cannot "set" the Reynolds number directly. It comes from the change in velocity, U, over a distance, L, divided by the viscosity, nu, or (U*L/nu). So the Reynolds number is inversely proportional to the viscosity. If you increase the viscosity in the sample problem, the Reynolds number will decrease. You will have to look at the output to determine the actual number - see 2 below. 2. The Reynolds number can be found by looking at the results. The change in flow velocity is ~0.1 and the distance over which it changes is ~0.5, so the Reynolds number is ~0.05 (0.1*0.5/1). See the attached plot - looking at the center above the blocking bar. 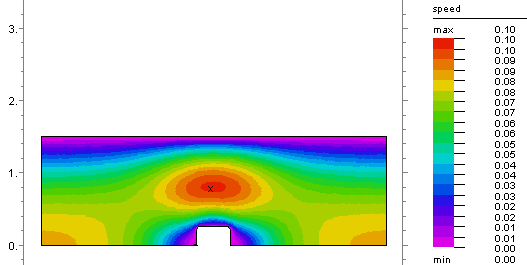 3. If you do not have the channel blocked, then just remove it from the region definition. You will not need 'rball' as that was used to define the size of the blocking bar. i.e. start(0,0) !value(v)=0 line to (Lx/2-rball,0) !value(u)=0 line to (Lx/2-rball,rball) bevel(cut) ! line to (Lx/2+rball,rball) bevel(cut) ! line to (Lx/2+rball,0) load(u)=0 line to (Lx,0) value(p)=p0 line to (Lx,Ly) value(u)=0 load(p)=0 line to (0,Ly) load(u)=0 value(p)=0 line to close | ||
Achariya (jam_acha) Junior Member Username: jam_acha Post Number: 3 Registered: 03-2009 |
Dear Dr. Nelson In comment of viscous.pde, I have a question thus 1. Where a hypothetical equation of state p(dens) = p0 + L*(dens-dens0) from? (source of "equation of state.") 2. Why in steady state, we can replace the dt(p) by -div(grad(p))? (I see in Help | Tech Notes | Smoothing Operators in PDEs then I don't understand, please explain.) 3. "The final pressure equation: div(grad(p)) = M*div(U) Here M has the dimensions of viscosity/distance^2." Why in script use 100*visc/rball^2? This rball is distance? If I don't have channel blocked by a bar of square cross-section,How can I should rball=? 4. In script, variables u(0.1) v(0.01) p(1) What the number 0.1,0.01,1 in parenthsis means? I ever remove it (I use u, v, p) but it no event. 5. If I want to plot streamline,how do? | ||
Robert G. Nelson (rgnelson) Moderator Username: rgnelson Post Number: 1230 Registered: 06-2003 |
1. This is a first order Taylor expansion of P as a function of dens. 2. dt(u)-eps*div(grad(u))=dt(v) creates u as a frequency-filtered approximation to v. If we assume that dt(u) is small and eps is 1, we can replace dt(v) by -div(grad(v)). 3. As explained in the notes to Viscous.pde, M has the dimensions of density/time or viscosity/distance^2. One way to generate a value for this which scales approximately as the problem parameters is visc/rball^2. If rball does not exist, use some other characteristic dimension of the problem. 4. See Help->Problem Descriptor Reference->the Sections of a Descriptor->Variables->the THRESHOLD clause. 5. FlexPDE does not currently have a streamline plot capability. You could export to a visualization package, or compute a streamline function from the curl of the velocity. See notes to Buoyant.pde. | ||
RWS (transpower) Member Username: transpower Post Number: 10 Registered: 12-2008 |
A streamline plot would be most helpful--or more generally, the capability to plot the orthogonal curves for any type of field. Currently, FlexPDE plots only one quantified field variable at a time, whereas what most of us need are two: the flux lines vs. the equipotential lines. It would be most helpful to have the numbers (for both the flux and the equipotentials) displayed right on the graph! That way, we wouldn't need the associated table of data. | ||
Robert G. Nelson (rgnelson) Moderator Username: rgnelson Post Number: 1233 Registered: 06-2003 |
You can plot equipotentials and field lines simultaneously. See the example problem "Fieldmap.pde" in the folder: V6: Samples|Applications|Electricity V5: Samples|Steady_State|Electricity. Versions 6.03 and later have level tables for both contour arguments. | ||
RWS (transpower) Member Username: transpower Post Number: 11 Registered: 12-2008 |
OK, a big improvement, I had been on version 6.02. But please note: I'd still much rather see the actual numbers (suitably scaled) on the graph, not just the labels for the table. (As an option, the numbers could be at right angles to one another for clarity.) This way I would be able to copy the graph directly into a scientific/engineering paper without needing the adjoining table! |