| Author | Message | ||||
oio14644 New member Username: oio14644 Post Number: 1 Registered: 10-2010 |
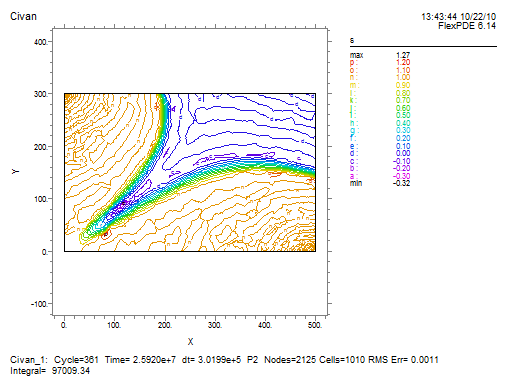
Dear Sir or Madam, I tried to use Flexpde to solve one problem(see attached file for more details). And I made the pde file for the problem, the results turn our kinds of success. The only problem is that surface(s) plot is not smooth, you can run the code to see it. Could you give me any advices on how to make more smooth plot? In addition, s (it is water saturation) should be in the range of 0 to 1, but the results turned out that sometimes, it is larger than 1, while other times it is negative, so do you know how to control it so that it can be kept in [0,1] during the calculation? PS, could you help check my code? Thanks very much! Wade | ||||
rgnelson Moderator Username: rgnelson Post Number: 1417 Registered: 06-2003 |
1) FlexPDE syntax rules continue to apply a boundary condition until it is changed. This causes s=1 to be applied around the entire perimeter. You must turn it off with NOBC(s) on the right and top. 2) The P equation is not time varying. You should compute it once in an auxiliary script and import it. (In version 6, you can simply use THEN to decouple the P equation. This repeats the P solution needlessly, but it accomplishes the result.) 3) Your initial conditions on S are discontinuous. This requires an infinite number of cells and an infinitesimal timestep to track the infinitely steep front accurately. With finite cell size, the polynomial interpolation will overshoot and undreshoot. Smooth the initial value transitions to avoid this. (This problem propagates a steep front. If you are using the student version of FlexPDE, you will not be able to make the mesh fine enough to resolve the shape of the front, and you will always have ringing.) 4) You should not wait until completion of the run to observe the results! The MONITOR facility has been provided so you can watch what the solution process is doing. Use it. The attached file will run under FlexPDE version 6, but not version 5. For version 5, use the two-script approach described in point (2).
 | ||||
oio14644 Junior Member Username: oio14644 Post Number: 3 Registered: 10-2010 |
Thanks very much! s (it is water saturation) should be in the range of 0 to 1, but the results turned out that sometimes, it is larger than 1, while other times it is negative, so do you know how to control it so that it can be kept in [0,1] during the calculation? | ||||
rgnelson Moderator Username: rgnelson Post Number: 1419 Registered: 06-2003 |
What you are seeing is simply interpolation error, because the quadratic interpolating functions of the finite element method are not flexible enough to follow the sharp breaks at the peak and foot of a steep front unless the mesh is very fine. These interpolation errors do not affect the mass conservation of the equations. If you want to make prettier plots, you can plot SURFACE(min(max(s,0),1)) This will not change the solution, but it will remove the spikes from the plot. |