| Author | Message | |||||
Bernd Vosseler (bernd) Member Username: bernd Post Number: 5 Registered: 02-2006 |
Dear Robert (or whoever else can help), my export routine to MatLab, which I need for post-processing simulation rsults, had become pretty stable -- as long as I was not using any Layers in my 3d-problem. To me, it doesn't look like a badly formulated problem descriptor. Could there be something wrong with FlexPDE's plot engine? Best regards, Bernd Vosseler I am exporting my Temperature fields by writing plots along lines in y-direction in .txt-files and putting them all back together in MatLab. Now I introduced layers into my problem, and suddenly things don't work anymore: I am getting empty plots along some lines. I found out, that they come in adjacent pairs, eg. line 104 and 105. I tried to get rid of them by either slightly tilting them with respect to the y-axis or by avoiding border points as start/stop points, but neither worked. What's the problem and how can I handle it? The attached Files are my prolem descriptor, one proper output and one empty output. Best regards, Bernd Vosseler
| |||||
Robert G. Nelson (rgnelson) Moderator Username: rgnelson Post Number: 710 Registered: 06-2003 |
It appears to me that you have taken your elevations exactly on the top surface of the domain, where roundoff errors in positioning of nodes or computing intersections can make the elevation trace appear to be outside the domain and therefore absent. I suggest you take your traces at a z-level that is unambiguously inside the figure, like z=-0.01*dicke. When you do this, all the traces have data. I have to wonder why it is necessary to take all these elevations. What is wrong with the exported data from the top surface contour? You can increase the number of points if you want. Use "points=100" or whatever density you need. Also, you can speed this problem up enormously if you leave the features out of the substrate. Use the declaration: limited feature 'spot2' layer 2 start (-dotx,0) arc (center=0,0) angle=360 | |||||
Bernd Vosseler (bernd) Member Username: bernd Post Number: 6 Registered: 02-2006 |
Hello Robert, thanks for your answer, especially the hint with the features speeded Things up from 17min to 3min -- not bad, if you run them by the dozen to do parameter evaluations. I need the elevation exports, because the 2d export routine does not output accurate data. To illustrate the point, here are Matlab Plots of the same problem -- the first one is using contour(Temp) on surface 3 EXPORT file=... points=400 the other one uses REPEAT i= 0 to 160 elevation(Temp) from (i/2-40,-breite_links,-0.01) to (i/2-40,breite_rechts,-0.01) as "Temp at x="+$i EXPORT file = ... ENDREPEAT Why do my data get noisy, when I export them as 2d Plots? Best regards, Bernd. 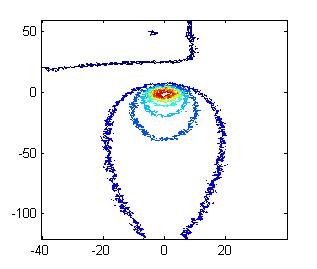 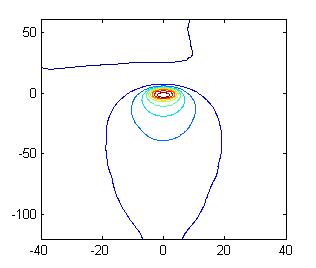 | |||||
Robert G. Nelson (rgnelson) Moderator Username: rgnelson Post Number: 714 Registered: 06-2003 |
I thought I had cured this problem back in February, but apparently not. You should have complained before. I will try to track down this error and post a correction. | |||||
Bernd Vosseler (bernd) Member Username: bernd Post Number: 7 Registered: 02-2006 |
Ahhh, now it's smoooth! Thank you, it's quite impressive how quick a complaint turns into a new release! I got you wrong in back in February -- I thought, you were correcting the error that lead to empty plots, so I had my workaround. Seems I were just lucky, that the empty plots did not show up again (I'm doing simulations rather unfrequently) Best regards, Bernd Vosseler |