| Author | Message | ||
Klaus Albers (k_albers) New member Username: k_albers Post Number: 2 Registered: 07-2005 |
Dear Dr. Nelson, I'm currently investigating cut planes in a 3D problem. When exporting contour data using the format modifier, I can readily read the files by Matlab, of course. However, the exported grid also covers points outside my (not rectangular) domain. The FlexPDE help says: "In 2D grids, table points which are outside the problem domain will also be bracketed by "{" and "}" and marked as "exterior". " If so, this would be of great help! I could just "switch" the outside points off and be happy. As it turns out, the "z-value" of the outside points seems to be some random number, so I am not able to automatically pick them. Is there a way to mark the exterior points that I just did not see? Thanks a lot Klaus | ||
Robert G. Nelson (rgnelson) Moderator Username: rgnelson Post Number: 617 Registered: 06-2003 |
I'm not sure I understand what you mean about the z-values. If you could send me a script that shows this problem it would help me understand. Send it to support@pdesolutions.com | ||
Klaus Albers (k_albers) Junior Member Username: k_albers Post Number: 3 Registered: 07-2005 |
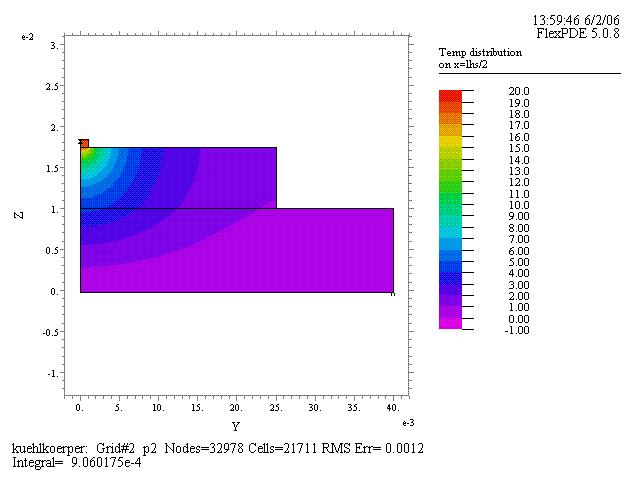
I'm exporting the contour plot by: CONTOUR (temp-273) PAINTED AS "Temp distribution" ON x=wem/2 EXPORT FORMAT "#y#b#z#b#" FILE="heatsink_yz.txt" The corresponding plot is shown in the figure below. As one can see, the point y(35 mm) / z(15 mm) is outside the domain. Here is an example line from heatsink_yz.txt: 0.0351020408 0.0149448976 0.0944024803 Obviously, there is no "outside-mark" or just a zero or s.th. For clarity, I made the attached contour plot of the data in Matlab. It shows the complete file data as a painted contour plot. Overlayed is a non-painted contour plot, where all data outside the domain is excluded. As one can see, there is no way to automatically distinguish outside points from inside points, because they have rather random values. So my question is: How can I get rid of the outside data, or is there a way to mark it in the file? I really enjoy FlexPDE, but without being able to do fast and automated post processing, it is consuming way too much time. In a scientific environment, data is superfluous when it can not be communicated. Thanks for your support Klaus p.s.: In Matlab, 3D data is commonly plotted as "z-values" over an xy-plane, that's why I call the temperature data "z-value".   | ||
Klaus Albers (k_albers) Member Username: k_albers Post Number: 4 Registered: 07-2005 |
I'm exporting the contour plot by: CONTOUR (temp-273) PAINTED AS "Temp distribution" ON x=wem/2 EXPORT FORMAT "#y#b#z#b#" FILE="heatsink_yz.txt" The corresponding plot is shown in the figure below. As one can see, the point y(35 mm) / z(15 mm) is outside the domain. Here is an example line from heatsink_yz.txt: 0.0351020408 0.0149448976 0.0944024803 Obviously, there is no "outside-mark" or just a zero or s.th. For clarity, I made the attached contour plot of the data in Matlab. It shows the complete file data as a painted contour plot. Overlayed is a non-painted contour plot, where all data outside the domain is excluded. As one can see, there is no way to automatically distinguish outside points from inside points, because they have rather random values. So my question is: How can I get rid of the outside data, or is there a way to mark it in the file? I really enjoy FlexPDE, but without being able to do fast and automated post processing, it is consuming way too much time. In a scientific environment, data is superfluous when it can not be communicated. Thanks for your support Klaus p.s.: In Matlab, 3D data is commonly plotted as "z-values" over an xy-plane, that's why I call the temperature data "z-value".   | ||
Klaus Albers (k_albers) Member Username: k_albers Post Number: 5 Registered: 07-2005 |
seems like the upload doesn't work with firefox, so i'll try it with IE:   | ||
Klaus Albers (k_albers) Member Username: k_albers Post Number: 6 Registered: 07-2005 |
ok, doesn't work as well, i'm not an expert in these things... i'll give it a last try and upload the files directly by "upload attachment" sorry for the inconvenient post... here we go: | ||
Robert G. Nelson (rgnelson) Moderator Username: rgnelson Post Number: 619 Registered: 06-2003 |
At some point in the distant past, the bracketing of the exterior points in { } was put on a switch. Add DROPOUT to your CONTOUR command, and the exterior points should be bracketed. | ||
Klaus Albers (k_albers) Member Username: k_albers Post Number: 7 Registered: 07-2005 |
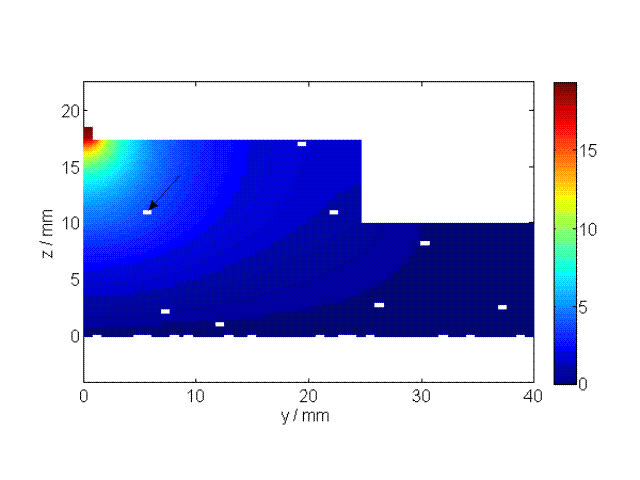
Alright, thanks for the fast solution. The outside points are marked correctly, BUT: some inside points are marked to be exterior as well. I attached two plots (FlexPDE and Matlab) to illustrate the problem. This is the data in the txt-file around the arrow : 0.0036363636 0.0108848469 4.2720092489 0.0040404040 0.0108848469 4.1624455919 0.0044444444 0.0108848469 4.0519485633 0.0048484848 0.0108848469 3.9369844993 0.0052525253 0.0108848469 3.8187364494 { exterior: 0.0056565657 0.0108848469 3.7009802294 } 0.0060606061 0.0108848469 3.5865754457 0.0064646465 0.0108848469 3.4734080171 0.0068686869 0.0108848469 3.3604424045 0.0072727273 0.0108848469 3.2509545664 0.0076767677 0.0108848469 3.1431818417 0.0080808081 0.0108848469 3.0388769652 Obviously, the mark is wrong. I tried different contourgrid and ngrid resolutions. Any solution for that?   | ||
Robert G. Nelson (rgnelson) Moderator Username: rgnelson Post Number: 620 Registered: 06-2003 |
FlexPDE uses an unstructured triangular computation mesh. Reporting values on an overlaid regular rectangular grid requires a lookup procedure to locate the mesh cell containing each grid point. We use a quadtree search procedure to find each grid point. It would appear that there are errors in the search procedure that produce false "external" reports. I will investigate this problem. |