| Author | Message | |||
Milton Lima (milton) Junior Member Username: milton Post Number: 3 Registered: 06-2004 |
Hi: I am using FlexPDE 4.0 to simulated laser heating of solid targets by pulsed lasers. I already produced the code for a single shot, based on a literature reference. Now I need to implement a code for a number of pulses with a given frequency. For example, the laser pulse length is 30 ns and the pulsing frequency is 13 kHz, so I have a pulse every 77 microseconds. Could you please help me? Another question how could I move the pulsed source over the y-axis? Thank you for your help. Milton.
| |||
Robert G. Nelson (rgnelson) Moderator Username: rgnelson Post Number: 456 Registered: 06-2003 |
1. The easiest way to generate a chain of pulses is Pulse=USTEP(cos(2*pi*t/tperiod)) To vary the duty cycle, observe that the amplitude of the cosine at t_on/2 is A=cos(pi*t_on/tperiod) Offsetting the argument of the USTEP by this amount gives Pulse=USTEP(cos(2*pi*t/tperiod)-A) To get the full width on the first pulse, offset by t_on/2: Pulse=USTEP(cos(2*pi*(t-t_on/2)/tperiod)-A) [I usually inveigh against discontinuous functions (like USTEP), but a discontinuous source is not as harmful as a discontinuous boundary value.] 2. You have defined a Gaussian deposition profile as a function of x and y. To move the pulse around in time, simply define a location Y0 as a function of time and offset the y coordinate in the argument of the exponential by Y0. 3. You have defined the threshold of Solid as 1, which is the full range. FlexPDE will track the initial stages of melting better if you use a smaller number. (After Solid has developed its full range, the threshold will become inoperative.) 4. There is a lot of noise in the Solid result at early times. You might want to increase the strength of the damping term a little. See attached.
| |||
Milton Lima (milton) Member Username: milton Post Number: 4 Registered: 06-2004 |
Hi Robert: Thanks a lot, I try this out. Regards, Milton. | |||
Dominic (dodo) New member Username: dodo Post Number: 1 Registered: 09-2005 |
Hi, could you please give your literature reference. Thank you for your help. Dominic | |||
Manoranjan Acharya (bubuisonline) New member Username: bubuisonline Post Number: 1 Registered: 05-2007 |
Hello Robort, I am trying to do a similar type problem.The problem I am facing is when the pulse width is 0.1sec the temperature profile looks ok to me but when the pulse width is 15microsec it the profile looks like a single pulse.Could you please help me.
| |||
Robert G. Nelson (rgnelson) Moderator Username: rgnelson Post Number: 850 Registered: 06-2003 |
What version of FlexPDE are you using? I ran this on version 5.0.16 and it seems to work correctly. See attached. You should put PLOT times at the beginning, middle and end of your pulses. FlexPDE does not micro-sample sources throughout each timestep, so there is the possibility that pulses can get missed by stepping completely over them. Plot times force time steps to align, and guarantee the source will be seen correctly. 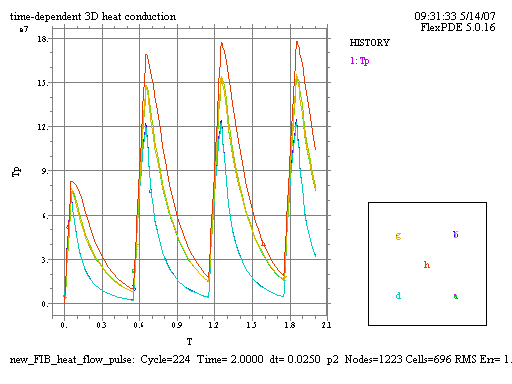 | |||
Manoranjan Acharya (bubuisonline) New member Username: bubuisonline Post Number: 2 Registered: 05-2007 |
Hello Robort, Thanks for your help.But I guess I could not convey my problem properly.The file I sent to you works fine for me too.But when I change the pulse width(t_on=.0000015) it is not showing the like the previous.I will be really great full if you look at it again.
| |||
Robert G. Nelson (rgnelson) Moderator Username: rgnelson Post Number: 851 Registered: 06-2003 |
The timesteps are jumping over your pulses. See my previous remarks about using PLOT times to force evaluations. Use PLOTS FOR T=0 by 0.6 to 2 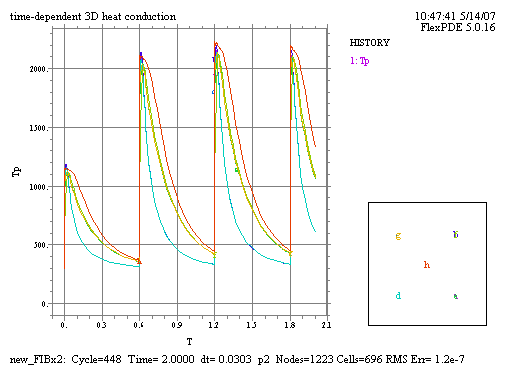 | |||
Robert G. Nelson (rgnelson) Moderator Username: rgnelson Post Number: 852 Registered: 06-2003 |
To get an accurate time integration of the source, you should use plot times at beginning, middle and end of pulses, as I suggested previously. | |||
Manoranjan Acharya (bubuisonline) Junior Member Username: bubuisonline Post Number: 3 Registered: 05-2007 |
Hi Robort, Thanks a lot for it. Manoranjan |